


Rising Rates: The Brakes Are Being Applied… Slowly
“Interest rates are to stock prices what gravity is to matter.”
— Warren Buffett1
Interest rates have been going UP. As of September 15, 2026, the 10-year Treasury yield had climbed from around 4% at the start of the year to roughly 5% — mortgage rates had gone from 6% to 7% right along with it, and inflation had crept from 2.4% to 3.4%.2 Watching those numbers climb, I keep asking the same thing: how far can rates rise before something gives? I’m not alone in that. Nearly 80% of families worth $25 million or more say they worry about inflation, market volatility and geopolitical instability.3
Here’s my honest answer… I don’t know. In my 32nd year as an investment advisor I’ve learned that my crystal ball on interest rates is every bit as cloudy as everyone else’s. What I DO know is that rates are the brake pedal on an economy. Nobody stomps on it. It gets pressed a little at a time — and the slowing shows up in places you don’t notice until you go looking for them.
So let’s go looking.
Where the brakes bite
Stocks versus a Treasury. When a U.S. Treasury yields around 5% — as the 10-year did on September 15, 2026 — stocks have to earn their keep, and plenty of investors are wondering whether it’s finally time to trade one for the other. Hold that thought — it’s the one place on this list where you actually get to make a decision.
Real estate. Using the mortgage rates cited above, buyers who need a mortgage are doing the math at 7% instead of 6%, and some of them will decide that those prices and rates simply don’t work together. If you own property you might sell someday, the buyer’s math eventually becomes YOUR math.
Assets that pay nothing. Gold and Bitcoin don’t pay interest or dividends. When cash and Treasuries paid close to zero, owning something with no yield cost you very little. Using 5% as the comparison, the price of waiting on an asset that pays nothing goes up every single year you hold it.
Companies that borrow to grow. Think of the giant technology companies building AI data centers. Alphabet, Meta, Amazon and Oracle alone have issued more than $300 billion in bonds since early 2025.4 That’s real money! Every point of higher interest makes that buildout more expensive to finance — and those same companies sit at the very top of the index most investors own. In J.P. Morgan’s May 20, 2026 analysis, the ten largest stocks made up 40.8% of the S&P 500.5 Think about that.
Everyone else who borrows. Families and businesses that would normally finance a big purchase start to think twice. That’s not a side effect — slowing down borrowing is how higher rates cool an economy in the first place.
I’ll add a confession on number four. During the dot-com era my young, inexperienced self found a way to lose way too much buying into the hype. I won’t forget. The AI buildout may turn out to be every bit as transformative as its champions say — I honestly don’t know — but a portfolio that leans on a handful of companies borrowing record sums is a lot less diversified than it looks.
Should you trade your stocks for that 5%?
Here’s the data. Dimensional Fund Advisors looked at nearly a century of markets — 1927 through 2025 — and split the years by whether short-term Treasury bill rates started the year above or below their long-run median. In the lower-rate years, the S&P 500 beat T-bills by an average of 9.9% a year. In the higher-rate years… 8.1%.6 Dimensional’s conclusion is that the gap isn’t statistically reliable, which in plain English means there’s no good evidence stocks reward you less just because rates are high. That makes sense when you think about it: investors price stocks off the risk-free rate PLUS a reward for taking risk, so when the risk-free rate goes up, the bar stocks have to clear goes up with it. (Past performance does not guarantee future results, and index returns don’t reflect fees or expenses.)
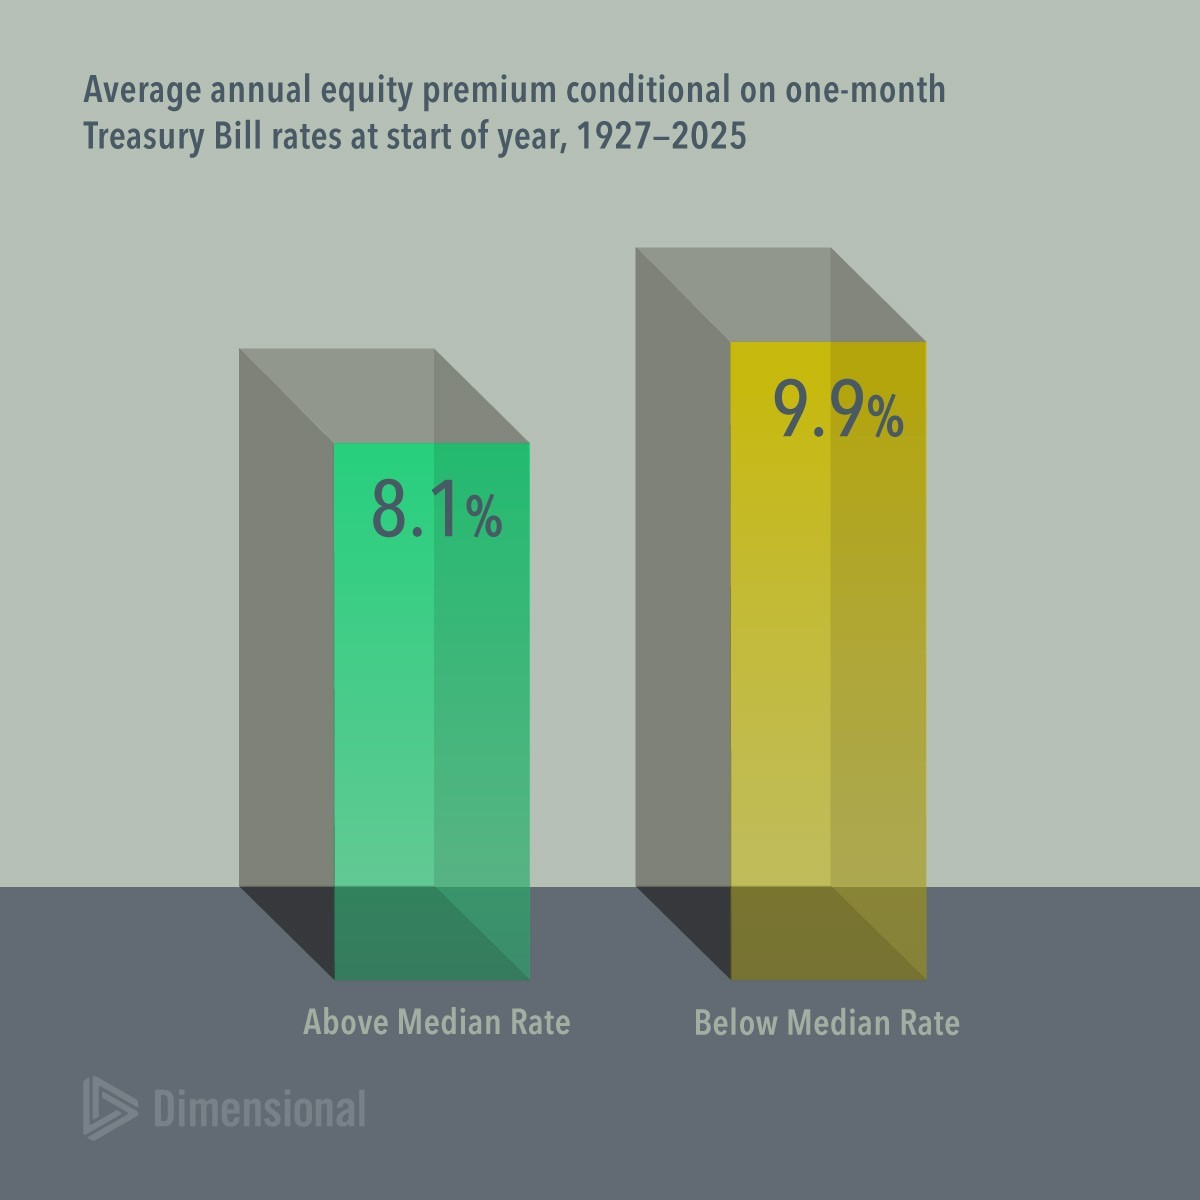
Source: Dimensional Fund Advisors, “Are Higher Rates Cause to Add More Fixed Income?,” September 10, 2026. Past performance is not a guarantee of future results. Equity premium is the return of the S&P 500 Index in excess of US Treasury bills. S&P data © 2026 S&P Dow Jones Indices LLC, a division of S&P Global. One-month Treasury Bill returns from Ken French data library. The difference between the two averages is not statistically reliable. The S&P 500 is an unmanaged index; investors cannot invest directly in an index.
Then there’s the tax man. Suppose — hypothetically — you sell a $1 million stock position in a taxable account with a $600,000 long-term gain. If the entire gain is subject to the top 20% capital gains rate plus the 3.8% net investment income tax, the potential federal tax liability is $142,800, assuming no offsetting losses and no state tax.7 That’s potential tax liability, not automatic withholding from the sale. Ouch. And the interest on that bond? Taxed as ordinary income, at rates up to 37%, plus the 3.8% net investment income tax when applicable. The devil is in the details, so talk to your tax professional before you do anything — but the payoff from switching is uncertain, and the tax bill is not.
None of this makes bonds a bad idea. Higher yields mean the bond side of a portfolio finally gets paid to do its real job — steadying the ride and funding near-term spending. If that’s why you own bonds, today’s yields are GOOD news!
What now?
Long-time readers know I don’t make predictions about where rates go next quarter — and this piece isn’t going to start. Here’s what I’d focus on instead:
Don’t trade your allocation on a yield. The right mix of stocks and bonds comes from how much risk you can afford, how much you’re comfortable with and how much you need to reach your goals. What a Treasury pays this year isn’t on that list.
Count the tax cost FIRST. If a change does make sense, the tax bill belongs in the decision from day one — and so does your CPA.
Look hard at concentration. If your stock portfolio is really a bet on the same handful of companies doing the borrowing, make sure you own the rest of the market too: international, small and value included.
Let your bonds do their job. High quality and short-to-intermediate maturities can help steady the portfolio. Even high-quality bonds can lose value as rates rise; shorter maturities reduce, but do not eliminate, interest-rate risk.
Bottom Line
Rates work like a brake — pressed slowly, felt unevenly, and in places nobody can map ahead of time. That’s exactly why the decision in front of most families isn’t “stocks or a 5% Treasury.” It’s whether the plan still fits their goals, their taxes and their timeline. Dispassionate decisions made with data around the dinner table — that’s how you get through a slowdown without stalling out…

Author
Mike Johnson, MBA
Mike Johnson works with individuals and families navigating major financial events where taxes can have an outsized impact—from selling a business or appreciated real estate to taking a significant retirement distribution. He specializes in event-driven tax mitigation, identifying opportunities to reduce unnecessary taxes before, during, and after these financial transitions. With more than 30 years of experience, he replaces emotion with data and makes complex strategies easier to understand. The goal is simple: help clients make informed decisions, keep more of what they’ve built, and have a tax and investment strategy they understand and trust.
Sources
1. Warren Buffett, 2017 interview, as quoted in AJ Tiarsmith, “Warren Buffett’s Famous Rule Says Interest Rates Are ‘Gravity’ for Stock Prices. Here’s What That Means as Treasury Yields Hit 5%,” 24/7 Wall St., September 15, 2026. https://247wallst.com/investing/2026/09/15/warren-buffetts-famous-rule-says-interest-rates-are-gravity-for-stock-prices-heres-what-that-means-as-treasury-yields-hit-5/
2. Ben Carlson, “Why Are Valuations Falling in a Bull Market?,” A Wealth of Common Sense, September 15, 2026. Figures are year-to-date as of that date. https://awealthofcommonsense.com/2026/09/why-are-valuations-falling-in-a-bull-market/
3. CEG Insights data, as reported in Michael Kitces and John Bowen, “The 3 Concerns Keeping $25M+ Families Up at Night,” Kitces.com, August 2025. https://www.kitces.com/blog/ultra-high-net-worth-family-concerns-25m-advisor-services-upmarket/
4. Jason Ma, “The AI boom is increasingly built on debt, but investor demand is plunging just as hyperscalers ramp up their bond blitz,” Fortune, July 17, 2026. https://fortune.com/2026/07/17/ai-boom-debt-blitz-investor-demand-hyperscaler-bond-issuance/
5. Meera Pandit and Corey Hill, “How extreme is market concentration?,” J.P. Morgan Asset Management, May 20, 2026. https://am.jpmorgan.com/us/en/asset-management/liq/insights/market-insights/market-updates/on-the-minds-of-investors/how-extreme-is-market-concentration/
6. Wes Crill, PhD, “Are Higher Rates Cause to Add More Fixed Income?,” Above the Fray, Dimensional Fund Advisors, September 10, 2026. S&P 500 Index return over one-month US Treasury bills, 1927–2025, years sorted by whether the one-month T-bill rate at the start of the year was above or below its historical median; the difference is not statistically reliable. Data: S&P Dow Jones Indices LLC; Kenneth R. French Data Library. Distributed by email; copy on file. Historical frequency, not a forecast. The S&P 500 is an unmanaged index; investors cannot invest directly in an index.
7. Hypothetical illustration only, not a projection or a recommendation: $600,000 × (20% + 3.8%) = $142,800. Assumes a long-term gain, the top 2026 federal brackets and no state tax. IRS, Rev. Proc. 2025-32, https://www.irs.gov/pub/irs-drop/rp-25-32.pdf; IRS, “Net Investment Income Tax,” https://www.irs.gov/individuals/net-investment-income-tax
Disclosures
All advisory services are offered through Savvy Advisors, Inc. (“Savvy Advisors”), an investment advisor registered with the Securities and Exchange Commission (“SEC”). Savvy Wealth Inc. (“Savvy Wealth”) is a technology company and the parent company of Savvy Advisors. Savvy Wealth and Savvy Advisors are often collectively referred to as “Savvy”.
Mike Johnson is an investment advisor representative registered with Savvy Advisors, Inc. (“Savvy”). All investment advisory services offered by Mike Johnson are offered through Savvy. Pillar Capital is an independent marketing brand name used by Mike Johnson for advertising and marketing purposes only. Pillar Capital and Savvy are not related or affiliated. For more information about Savvy, please visit our website.
Material prepared herein has been created for informational purposes only and should not be considered investment advice or a recommendation. Information was obtained from sources believed to be reliable but was not verified for accuracy. It is important to note that federal tax laws under the Internal Revenue Code (IRC) of the United States are subject to change, therefore it is the responsibility of taxpayers to verify their taxation obligations.
Companies named are for illustration only and are not recommendations to buy or sell any security.