


When Good Returns Start to Feel Normal

When you look at the strong market we have experienced since 2009, it’s hard to imagine a market like those we hear about in the past. It can seem like another lifetime. I hear people quote 10% returns as if it’s a guarantee for the future, but that’s less surprising when you consider that most millennials and Gen Z have only invested since 2009.
The bull market that began in March 2009 ran almost 11 years, the longest on record by the most common measure.1 If we’re not careful, we might think this is the norm and that markets will behave in the near future like they have for the last 15+ years. But we can’t forget that from 2000 through 2009, the S&P 500’s annualized return was negative 0.95%.2
For many of us, a prolonged bear market or a recession can start to feel more like whispers in the wind, leading us to forget periods like the 2000s. But history tells us we will have a recession and a bear market. We just don’t know when, how deep or how long.
Recency Bias
This inclination to weigh more heavily recent events is a behavioral bias known as recency bias. It’s an especially strong bias in the investing world.3 Studies have found that people who lived through strong markets take more risk,4 and that investors expect higher returns after markets have done well, while valuation-based estimates point lower.5
Recency bias could lead us to assume that future returns are higher than what the math shows or that future bull markets will last as long as this one. It’s important to recognize when recency bias might be impacting the lens in which you view your financial decisions.
Here are three examples of recency bias:
1. Expecting steady returns and quick recoveries
U.S. stocks have averaged about 10% a year since 1926, but the average just doesn’t arrive in 10% installments. Only seven of the last 100 years had returns within two percentage points of 10%.6 That’s a lot of volatility.
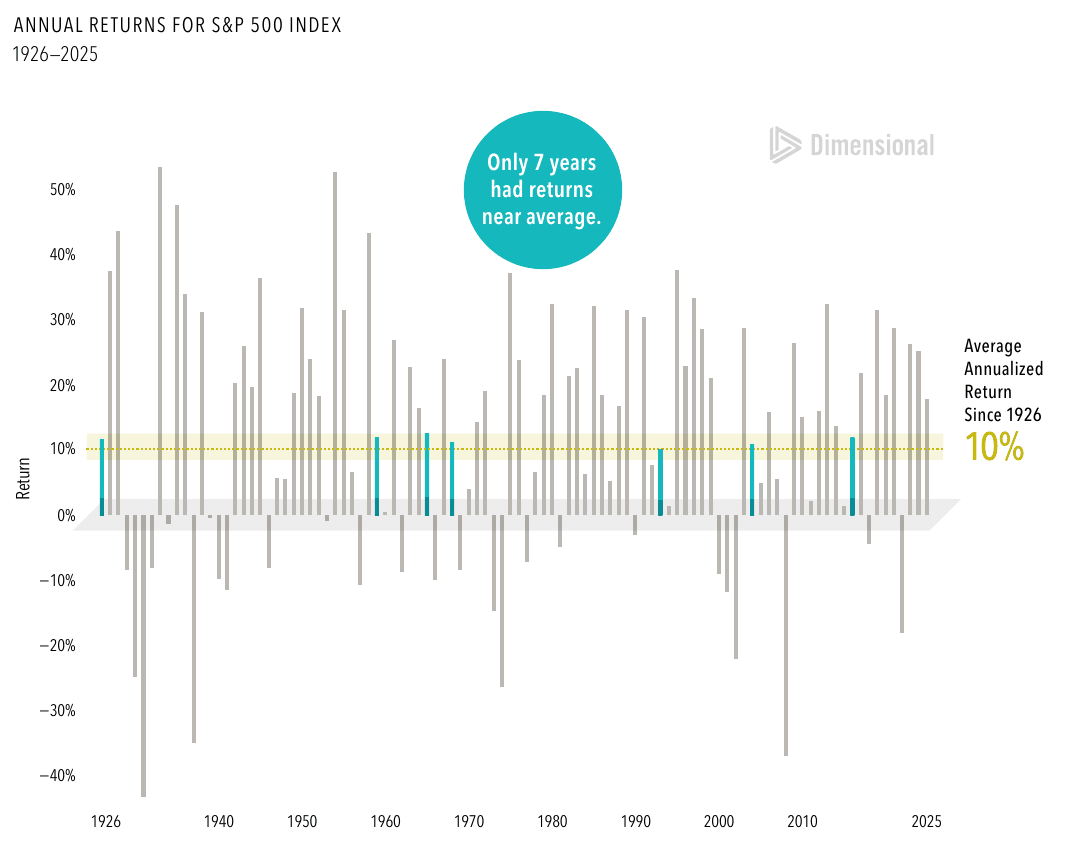
Source: Dimensional Fund Advisors, The Bumpy Road to the Market’s Long-Term Average, January 2026. S&P 500 annual returns, 1926 to 2025, in USD. S&P data © 2026 S&P Dow Jones Indices LLC, a division of S&P Global. All rights reserved. Indices are not available for direct investment. Past performance is no guarantee of future results.
Downturns don’t follow a set pattern either. It’s possible that the recoveries since 2009 have taught many investors to treat every decline as a short-lived buying opportunity. But history doesn’t support that conclusion. The only U.S. recession since 2009 lasted two months. Since 1854, the average has been 17 months.7
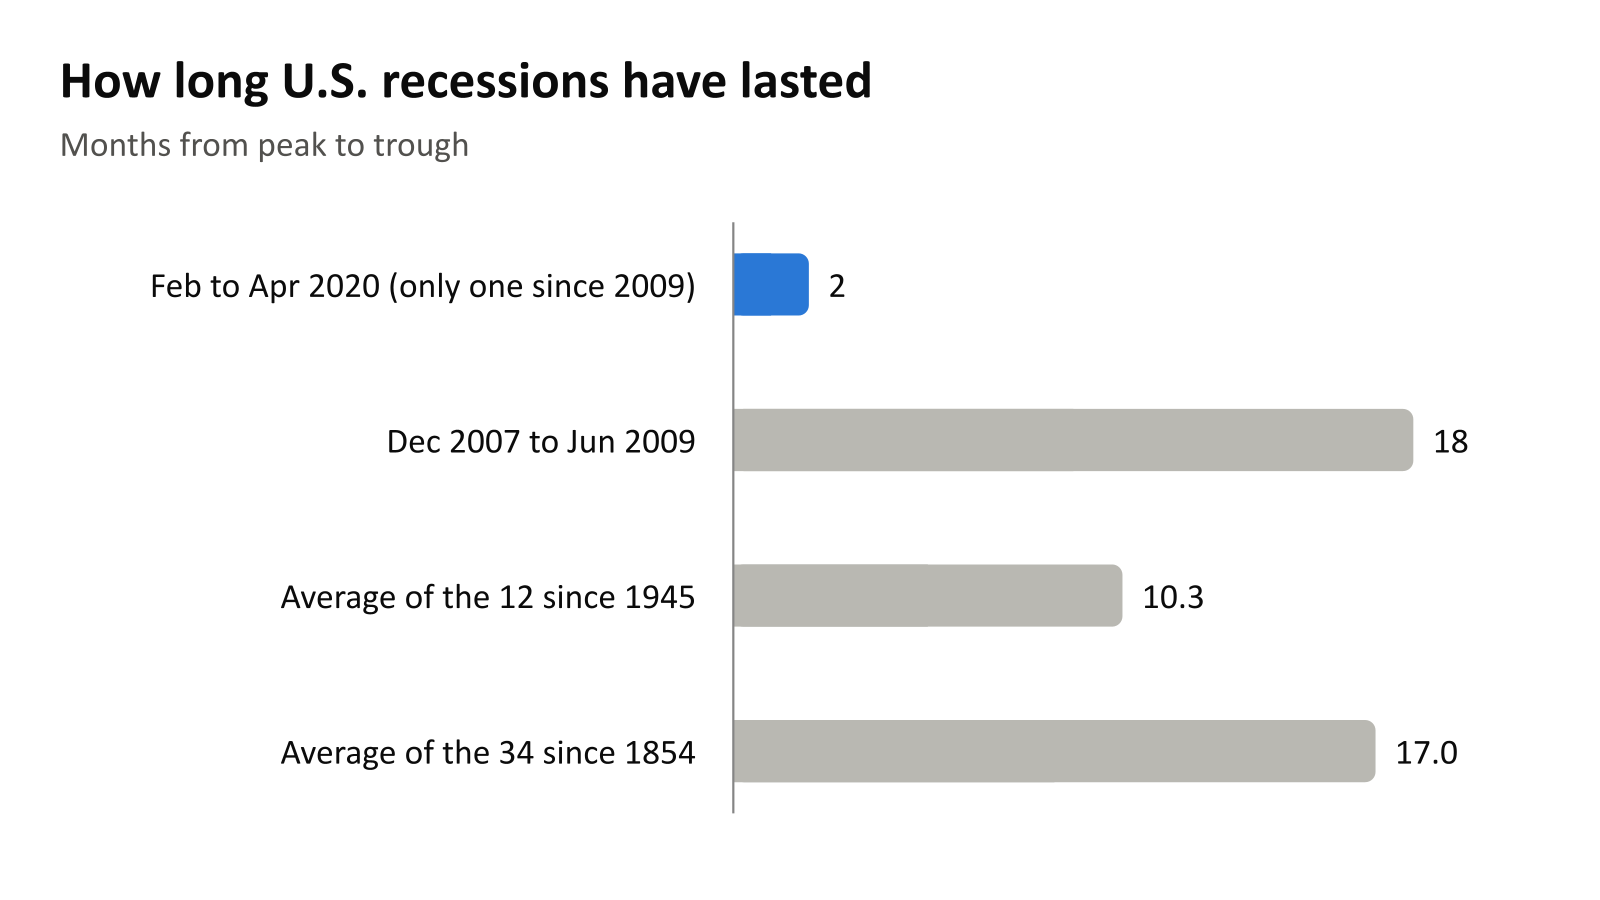
Source: National Bureau of Economic Research, US Business Cycle Expansions and Contractions. Months from business cycle peak to trough.7
The 10% average is real, but the path to it has included some big losing years and long downturns, such as the Global Financial Crisis (GFC) recession that lasted 18 months as recently as 2007 to 2009.7 A plan that only works with steady returns and quick recoveries is relying on the last 15 years to repeat.
2. Owning more of what has worked
When one stock has done especially well, it can grow into a large share of your portfolio.8 If that recent performance is the main reason you expect it to keep outperforming, recency bias is influencing the decision. Since 1926, the median ten-year return on individual U.S. stocks has been 7.9% below the broad market.9
The same pull works at the country level. U.S. stocks beat other markets from 2009 to 2024, and many investors began asking whether international diversification was worth the bother.10 From 2000 through 2009, the S&P 500 lost 9.1% while international and emerging markets both gained.11 We can’t reliably pick the next leader in advance, which is why we diversify globally.
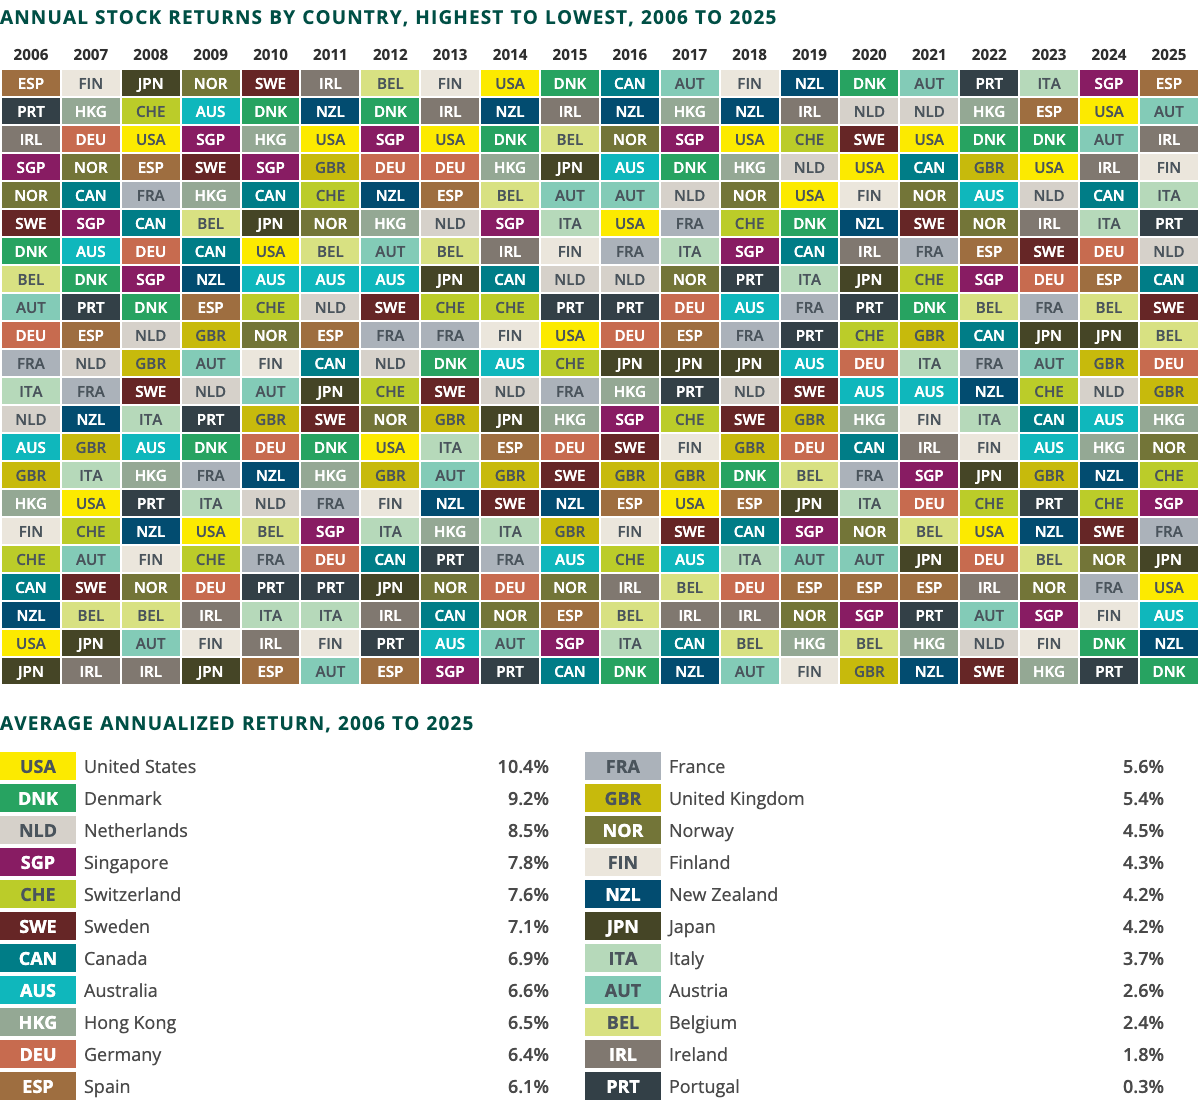
Source: Dimensional Fund Advisors, The Randomness of Global Stock Returns, January 2026. MSCI country indices (net dividends) for 22 developed markets, ranked by calendar-year return, 2006 to 2025, in USD. Does not include Israel, which MSCI classified as an emerging market before May 2010. MSCI data © MSCI 2026, all rights reserved. Indices are not available for direct investment. Past performance is no guarantee of future results.12
3. Mortgage rates
Recency bias shows up outside the portfolio too. The average 30-year mortgage rate was 7.40% on October 8.13 That feels high next to the roughly 3% rates of 2020 and 2021, but it’s below the 7.68% average since 1971.14 We may be tempted to wait until rates get back to 3%, or buy now assuming we can refinance when they do. There’s no guarantee rates will return to that level.
Conclusion
Recency bias is one of several biases that affect how we invest, and it’s possible that right now it’s the biggest offender in risky investor behavior.
My recommendation: before your next financial decision, consider how recent events might be impacting your choices.

Author
Clayton Johnson, CPWA®, CFP®
Clayton Johnson is a Wealth Advisor at Savvy with more than 10 years of experience helping business owners, executives, and affluent families navigate complex financial decisions. His work brings together tax planning, investment strategy, estate and wealth transfer planning, executive compensation, and broader financial planning.
Sources
1. CNBC. Bull market becomes the longest on record. August 22, 2018. “3,453 days later, the US bull market becomes the longest on record.” Dated from the March 9, 2009 low. Measured from 1987, the 1987 to 2000 advance was longer because the 1990 decline of 19.92% fell short of the 20% bear-market threshold, hence “by the most common measure.”
2. Dimensional Fund Advisors. A Tale of Two Decades. S&P 500 annualized return of negative 0.95% for 2000 through 2009.
3. Charles Schwab Investment Management, Investments & Wealth Institute and Cerulli Associates, via Business Wire. BeFi Barometer 2020: Behavioral Finance Techniques Help Advisors Keep Clients Invested Through Market Volatility. September 8, 2020. Survey of more than 300 advisor members of the Investments & Wealth Institute, fielded May and June 2020. Recency bias cited by 35% of advisors, the most common client bias, as in 2019. Self-reported survey data.
4. Ulrike Malmendier and Stefan Nagel. Depression Babies: Do Macroeconomic Experiences Affect Risk Taking? February 2011.
5. Robin Greenwood and Andrei Shleifer. Expectations of Returns and Expected Returns. Review of Financial Studies 27, no. 3 (2014): 714 to 746. Investor expectations are “highly positively correlated” with past stock returns and “strongly negatively correlated with model-based expected returns.”
6. Dimensional Fund Advisors. The Bumpy Road to the Market’s Long-Term Average. January 2026 edition. Annual returns for the S&P 500 Index, 1926 to 2025: annualized return of about 10%; annual returns within two percentage points of the long-term average in seven of the past 100 years; range from up 54% to down 43%. In USD. S&P data © 2026 S&P Dow Jones Indices LLC, a division of S&P Global. Indices are not available for direct investment.
7. National Bureau of Economic Research. US Business Cycle Expansions and Contractions. Contractions measured in months from business cycle peak to trough. February 2020 to April 2020: 2 months. December 2007 to June 2009: 18 months. Average contraction: 10.3 months for the 12 cycles from 1945 to 2020; 17.0 months for the 34 cycles from 1854 to 2020.
8. FINRA. Concentrate on Concentration Risk. June 15, 2022. Concentration arising from investment performance and its effect on portfolio risk.
9. Antti Petajisto. Underperformance of Concentrated Stock Positions. Working paper, June 2023, CRSP data 1926 to 2022. “Since 1926, the median ten-year return on individual U.S. stocks relative to the broad equity market is –7.9%, underperforming by 0.82% per year.”
10. Antti Ilmanen and Thomas Maloney, AQR Capital Management. Exceptional Expectations: U.S. vs. Non-U.S. Equities. May 2025. “US equities outperformed other markets in the 1990s, and the 15 years from 2009 to 2024.”
11. Dimensional Fund Advisors. Why Should You Diversify? April 1, 2020. Exhibit 2, total cumulative returns from January 2000 to December 2009: S&P 500 Index −9.10%, MSCI World ex USA Index (net dividends) 17.47%, MSCI Emerging Markets Index (net dividends) 154.28%. Decade comparison from 1900 to 2010 based on Dimson-Marsh-Staunton Global Returns Data. S&P data © 2020 S&P Dow Jones Indices LLC; MSCI data © MSCI 2020, all rights reserved.
12. Dimensional Fund Advisors. The Randomness of Global Stock Returns. Dimensional Quick Take, January 2026. Annual returns for 22 developed markets, ranked, 2006 to 2025, with average annualized returns for the period from 10.4% (USA) to 0.3% (Portugal). In USD. MSCI country indices (net dividends) for each country listed; does not include Israel, which MSCI classified as an emerging market prior to May 2010. MSCI data © MSCI 2026, all rights reserved. Indices are not available for direct investment.
13. Freddie Mac. Mortgage Rates Average 7.40%. October 8, 2026. Accessed October 12, 2026.
14. Freddie Mac Primary Mortgage Market Survey, via the Federal Reserve Bank of St. Louis. 30-Year Fixed Rate Mortgage Average in the United States (MORTGAGE30US). Author’s calculation: arithmetic mean of 2,898 weekly observations from April 2, 1971 through October 8, 2026, 7.6804%, rounded to 7.68%. This is a calculation from the series, not an average published by Freddie Mac. The annual averages were approximately 3.11% in 2020 and 2.96% in 2021. Accessed October 12, 2026.
15. Larry Swedroe. Buy the Dip? Not So Fast. Financial Advisor, August 7, 2026. Describes a May 2026 study by Javier Estrada (IESE Business School) of U.S. stock and bond data from February 1871 through December 2025 (Robert Shiller dataset): one year after the average negative month, stocks returned 9.1%, versus 11.0% after the average month of any kind; moving 25% of a 60/40 portfolio’s bond holdings into stocks after a down month did not deliver better risk-adjusted returns than buy-hold-rebalance, and tests across other allocations, dip sizes and transfer amounts largely confirmed it. Historical returns, not a forecast; the study ignores transaction costs and taxes.
16. Mincheol Kim, Computers in Human Behavior Reports, 2026. A synthesis of 21 experiments with 13,600 participants; the penalty is roughly 2.4 times larger for “tasks normatively expected to require human creativity, empathy, or authentic relational engagement.” As summarized in Confluence for 10.11.26, Confluence, October 11, 2026.
Disclosures
All advisory services are offered through Savvy Advisors, Inc. (“Savvy Advisors”), an investment advisor registered with the Securities and Exchange Commission (“SEC”). Savvy Wealth Inc. (“Savvy Wealth”) is a technology company and the parent company of Savvy Advisors. Savvy Wealth and Savvy Advisors are often collectively referred to as “Savvy”.
Mike Johnson is an investment advisor representative registered with Savvy Advisors, Inc. (“Savvy”). All investment advisory services offered by Mike Johnson are offered through Savvy. Pillar Capital is an independent marketing brand name used by Mike Johnson for advertising and marketing purposes only. Pillar Capital and Savvy are not related or affiliated. For more information about Savvy, please visit our website.
Clayton Johnson is an investment advisor representative registered with Savvy Advisors, Inc. ("Savvy"). All investment advisory services offered by Clayton Johnson are offered through Savvy. Pillar Capital is an independent marketing brand name used for advertising and marketing purposes only. Pillar Capital and Savvy are not related or affiliated. For more information about Savvy, please visit our website.
Pillar Capital may describe its services as “fee-only” based on the fact that it receives compensation solely from asset-based advisory fees for its advisory services. However, investment advisory services are provided through Savvy Advisors, which receives additional forms of compensation from sources other than asset-based advisory fees. As a result, Savvy is considered “fee-based” under CFP Board® guidelines. Clients should understand that advisory services are provided by Savvy, and Savvy’s overall compensation structure includes revenue streams beyond asset-based fees. Additional information regarding fees, compensation, and potential conflicts of interest is available in Savvy’s Form ADV.
Certified Financial Planner Board of Standards Center for Financial Planning, Inc. owns and licenses the certification marks CFP®, CERTIFIED FINANCIAL PLANNER™, and CFP® (with plaque design) in the United States to Certified Financial Planner Board of Standards, Inc., which authorizes individuals who successfully complete the organization’s initial and ongoing certification requirements to use the certification marks.
Pillar Capital may use artificial intelligence (“AI”) and other technology tools in certain aspects of its business operations, including administrative processes, research, planning, compliance, risk monitoring, and client service. The use of AI is intended to support, and not replace, the professional judgment, oversight, and fiduciary responsibilities of the Adviser and its investment professionals.
Material prepared herein has been created for informational purposes only and should not be considered investment advice or a recommendation. Information was obtained from sources believed to be reliable but was not verified for accuracy. It is important to note that federal tax laws under the Internal Revenue Code (IRC) of the United States are subject to change, therefore it is the responsibility of taxpayers to verify their taxation obligations.
This communication is for informational and educational purposes only and should not be construed as specific investment, accounting, legal, or tax advice. All investments involve risk, including the potential loss of principal. Past performance does not guarantee future results. The information presented is based on sources believed to be reliable but cannot be guaranteed as to accuracy or completeness.
Index returns are shown for illustration only. Indices are unmanaged, do not reflect fees or expenses, and cannot be invested in directly. Diversification does not ensure a profit or protect against loss in a declining market.
Charts and data from third parties, including Dimensional Fund Advisors, S&P Dow Jones Indices and MSCI, are used for illustration, and links to third-party websites are provided for reference. Savvy and Pillar Capital do not endorse and are not responsible for third-party content. Mention of any company is not a recommendation to buy or sell its securities.